Why Your Shopify Conversion Rate Is Harder to Move Than You Think
The average Shopify store converts at 1.4%. The top 20% convert at 3.1% or higher. That gap — 1.7 percentage points — sounds small but represents a doubling of revenue from the same traffic.
Most merchants chase that gap with the usual playbook: faster page loads, better product photos, smarter email sequences, discount codes. These tactics work at the margin. But they all share the same ceiling: they cannot solve the fundamental problem of online shopping, which is that customers cannot try products on before they buy.
This is not a UX problem. It is a sensory problem. When a customer cannot touch, wear, or see how a product looks on their own face or body, they hesitate. They add to cart then abandon. They buy then return. They bounce to a competitor who makes them feel more confident.
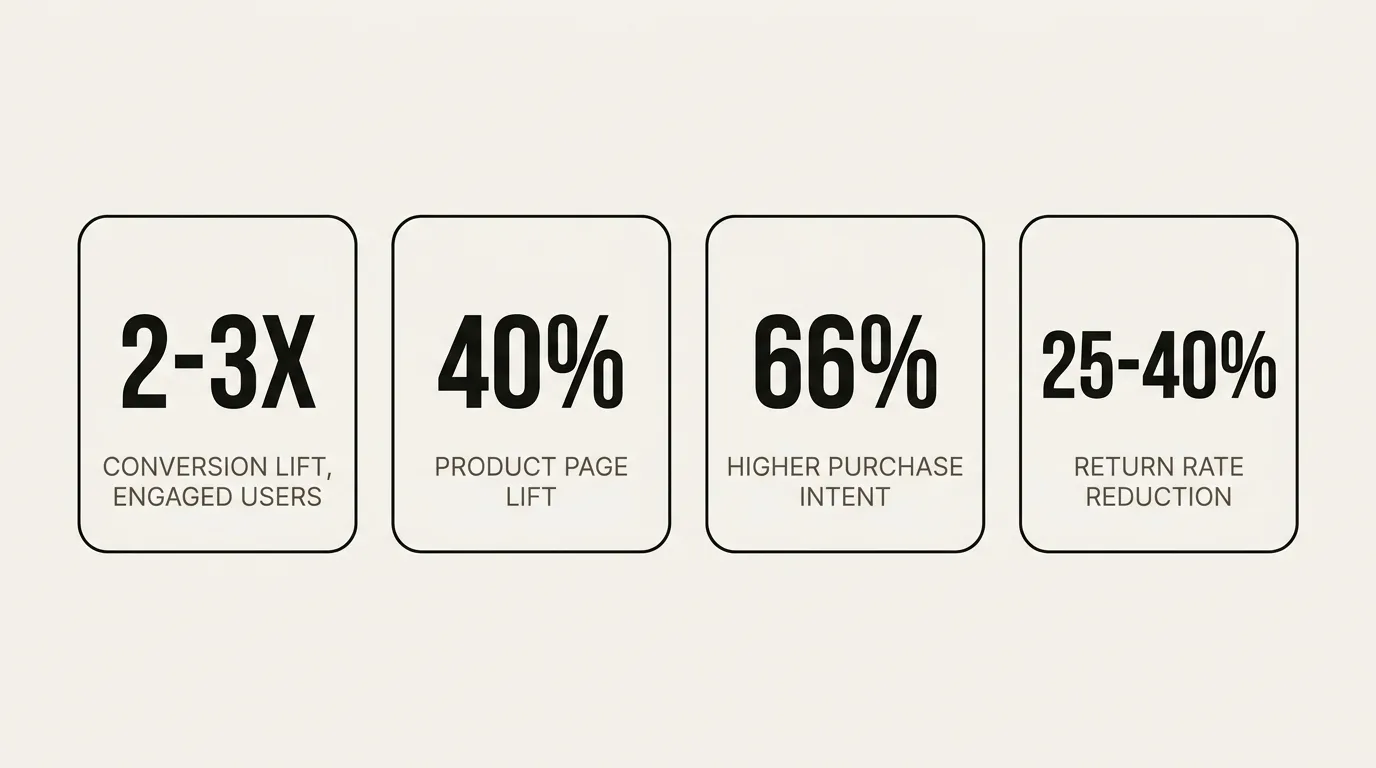
AR virtual try-on is the only intervention that addresses this root cause directly. And the conversion data, across hundreds of merchants, is consistent: customers who use the try-on feature convert at 2–3× the rate of those who do not.
This guide covers exactly how to implement it on Shopify and where the biggest conversion gains come from.
The Conversion Mechanics of AR Try-On
Before getting into tactics, it helps to understand why AR try-on improves conversion in the first place. There are three distinct mechanisms at work.
1. Eliminating Decision Uncertainty
The single biggest driver of cart abandonment is uncertainty. Customers who are not sure whether a product will look right on them default to "don't buy." AR try-on shifts the decision from hypothetical to experiential — the customer sees the product on themselves, and uncertainty collapses.
This effect is strongest for products where appearance is the primary purchase criterion: eyewear, jewelry, watches, hats, and clothing. For these categories, AR try-on does not just help the customer — it removes the primary barrier to purchase.
2. Increasing Time on Product Page
Customers who interact with the try-on feature spend significantly more time on the product page — typically 3–5× longer than non-users. More time spent means more consideration, more emotional connection with the product, and higher intent. Shopify merchants with try-on consistently report lower bounce rates on product pages where the feature is enabled.
3. Reducing Return Anxiety
Experienced online shoppers know that buying can mean returning. If a customer suspects they might regret a purchase, they hold back. AR try-on reduces return anxiety because the customer has already seen the product on themselves — the mental image of "I'm not sure this will work" has been replaced by "I can see it works." This is especially powerful in categories with historically high return rates.
Benchmarks: What the Research Actually Shows
Several large-scale studies have quantified the impact of AR try-on on e-commerce conversion. The numbers below come from third-party research — not vendor marketing materials.
Conversion rate lift for customers who engage with AR try-on:
Vertebrae, a 3D and AR commerce platform later acquired by Snap, published one of the most widely cited studies in this space. Their analysis of AR-enabled product pages found that customers who interacted with AR features converted at 2–3× the rate of customers who viewed standard product images. This is the figure you will see referenced across the industry — and it is specifically the conversion rate of AR-engaged users versus non-engaged users on the same page, not an overall store conversion lift.
Shopify's own published data frames it differently: enabling AR on product pages lifts overall product page conversion by around 40%. The gap between these two numbers — 40% page lift vs. 200%+ for engaged users — reflects adoption. Not every visitor uses the try-on feature. The page-level lift is the blended effect across all visitors; the per-user lift is what happens when someone actually tries it.
Purchase intent lift from AR:
Snap and Publicis Groupe conducted a study of AR-enabled shopping ads and found 66% higher purchase intent compared to standard ads. Google's AR Shopping data shows a similar figure. These numbers come from ad contexts rather than on-site try-on, but they reflect the same underlying mechanism — seeing a product on yourself increases confidence and intent.
Return rate reduction:
Multiple industry analyses place virtual try-on's impact on return rates at 25–40% for categories where fit or appearance is the primary purchase uncertainty. This range is consistent across eyewear, clothing, and accessories research, though the exact figure depends heavily on how prominently the feature is positioned and how engaged customers are with it.
What this means in practice:
The honest framing is this: if you enable AR try-on and 15% of your product page visitors use it, those users will likely convert at 2–3× your baseline rate. The lift for your overall page will be smaller — roughly proportional to your engagement rate. A store with 15% try-on engagement and a 3× lift for engaged users would see roughly a 30% lift in overall product page conversion. That is still substantial and, for most merchants in fit-critical categories, more than enough to justify the setup cost.
Where to Enable Try-On First: Prioritizing by Impact
Not every product in your catalog will benefit equally from try-on. Here is how to prioritize for maximum conversion impact.
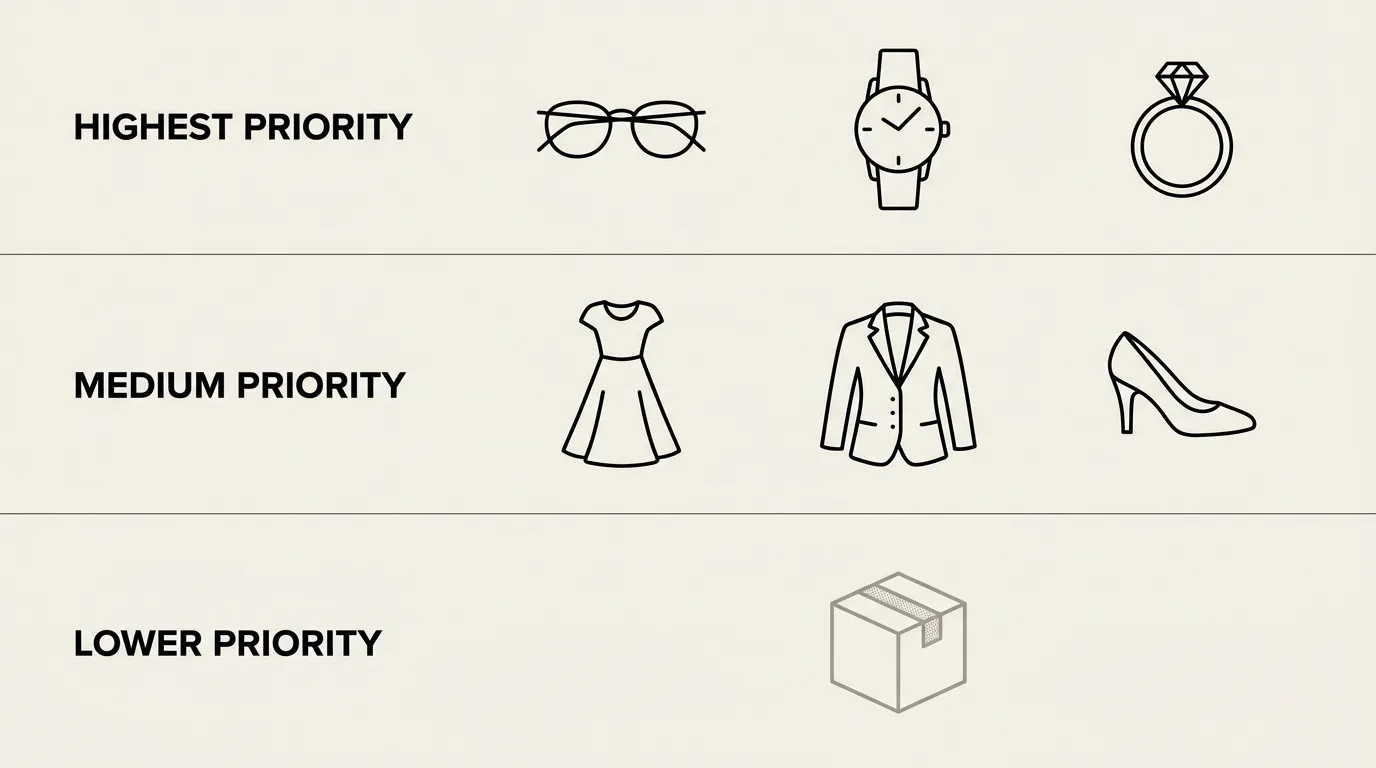
Highest Priority: Fit-Critical Products
Products where the primary purchase risk is "will this look right on me?" deliver the highest lift. For Shopify merchants, this typically means:
- Eyewear — frames are highly personal; customers have strong opinions about what looks good on their face
- Watches — case size relative to wrist, strap color against skin tone
- Jewelry — necklaces and earrings are often bought as style statements, and confidence in how they look drives purchase
For these categories, enabling real-time AR try-on converts at the highest multiples.
Medium Priority: Size and Style Uncertainty Products
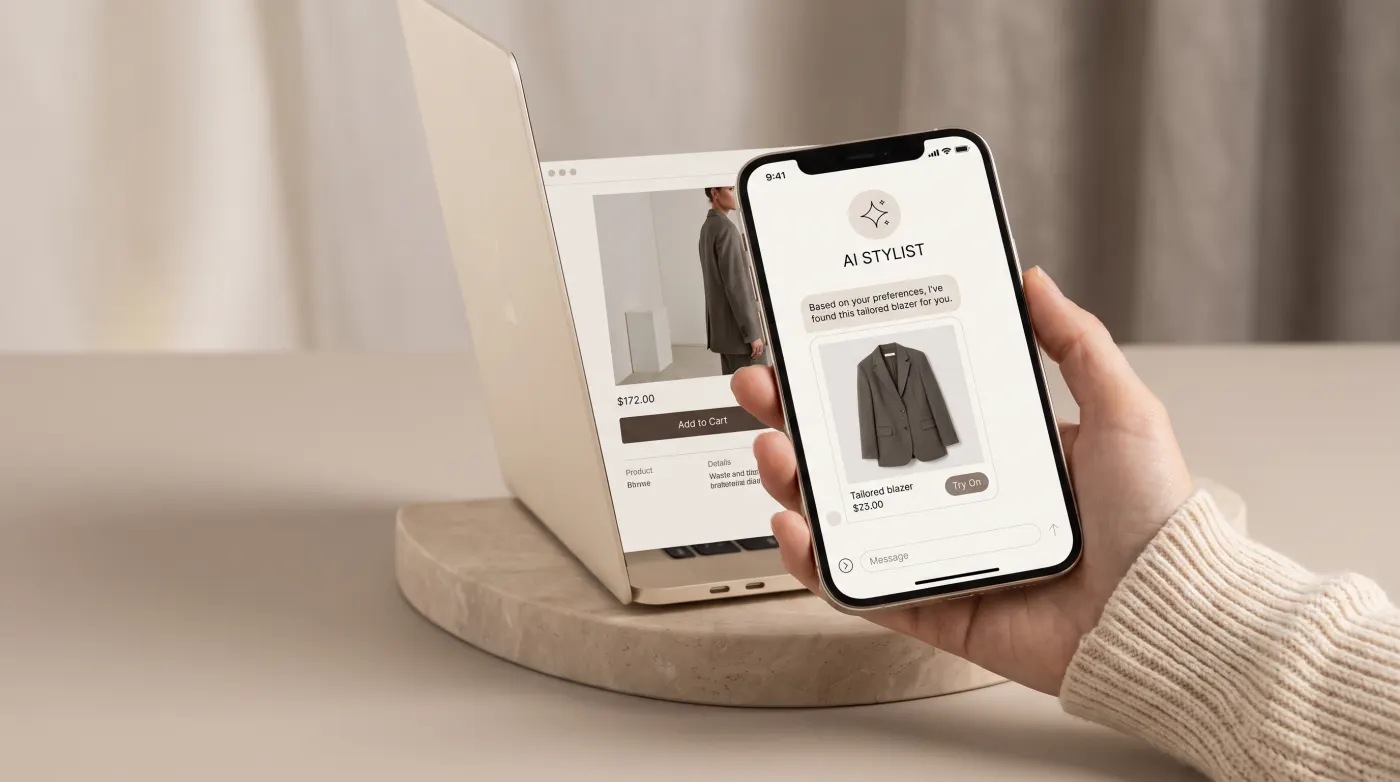
Clothing and footwear benefit heavily from AI photo swap try-on, where customers upload a photo to see how an item looks on their actual body. This addresses both the "does this style suit me?" and "does this fit my body?" questions simultaneously.
Enable AI swap try-on for:
- Dresses and formal wear (highest return rates, highest uplift)
- Outerwear and jackets
- Shoes and boots
Lower Priority: Pure Commodity Products
If you sell products where appearance on the customer is irrelevant — accessories like phone cases, home goods, supplements — try-on will not move your conversion metrics. Focus your implementation effort on the categories above.
Shopify Implementation: Step by Step
Getting try-on live on your Shopify store takes under a day if your products are in scope. Here is the full path.
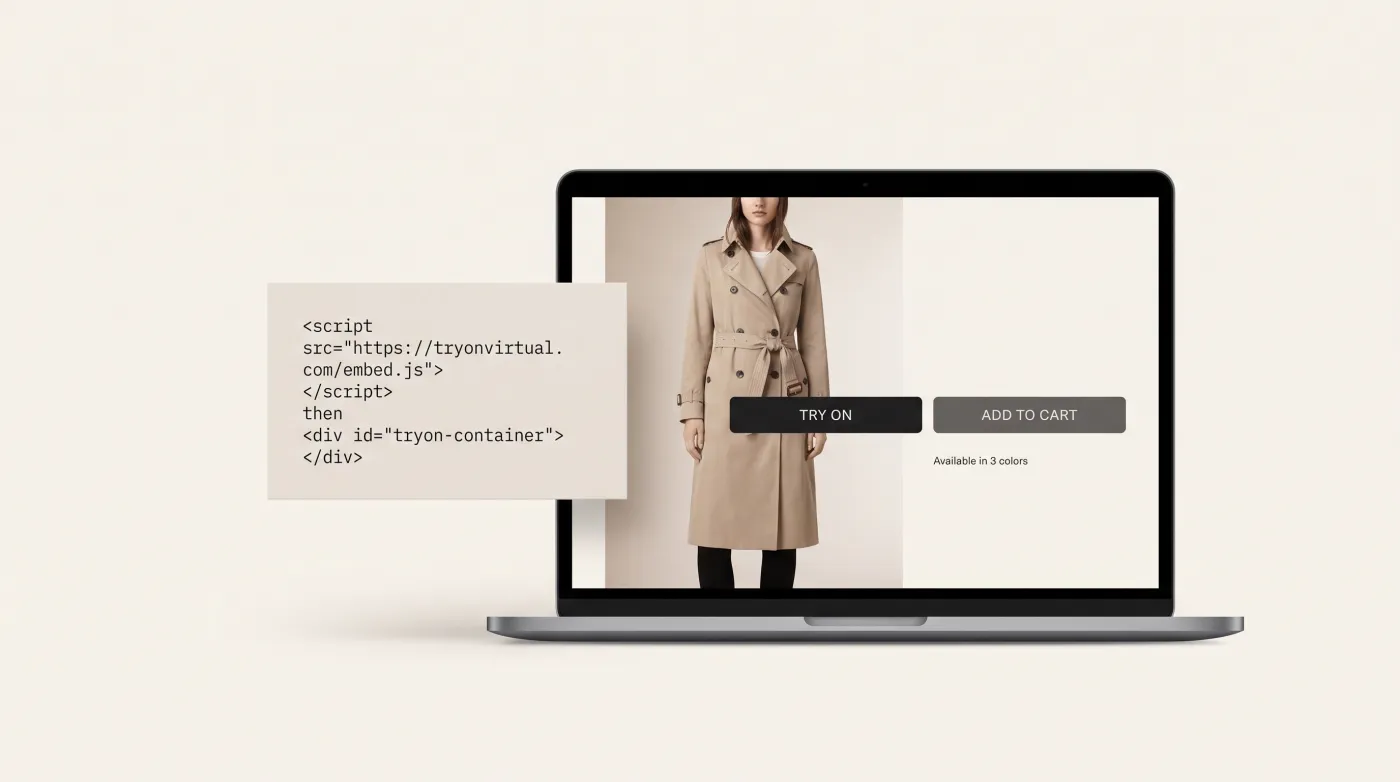
Step 1: Install TryOn Virtual from the Shopify App Store
Install the app and connect it to your store. The Shopify theme extension handles all storefront code — no developer needed.
Step 2: Generate or Upload Your 3D Models
For real-time AR (eyewear, watches), you need 3D models of your products. TryOn Virtual's built-in generation pipeline creates them from your existing product photos — typically in just a few minutes per product, and they go live in your try-on widget automatically. For AI photo swap (clothing, shoes), your existing product images work immediately. No 3D pipeline required.
Step 3: Enable the Theme Extension
In your Shopify admin, go to Online Store → Themes → Customize. Add the TryOn Virtual block to your product page template. The try-on button appears automatically on products you have connected.
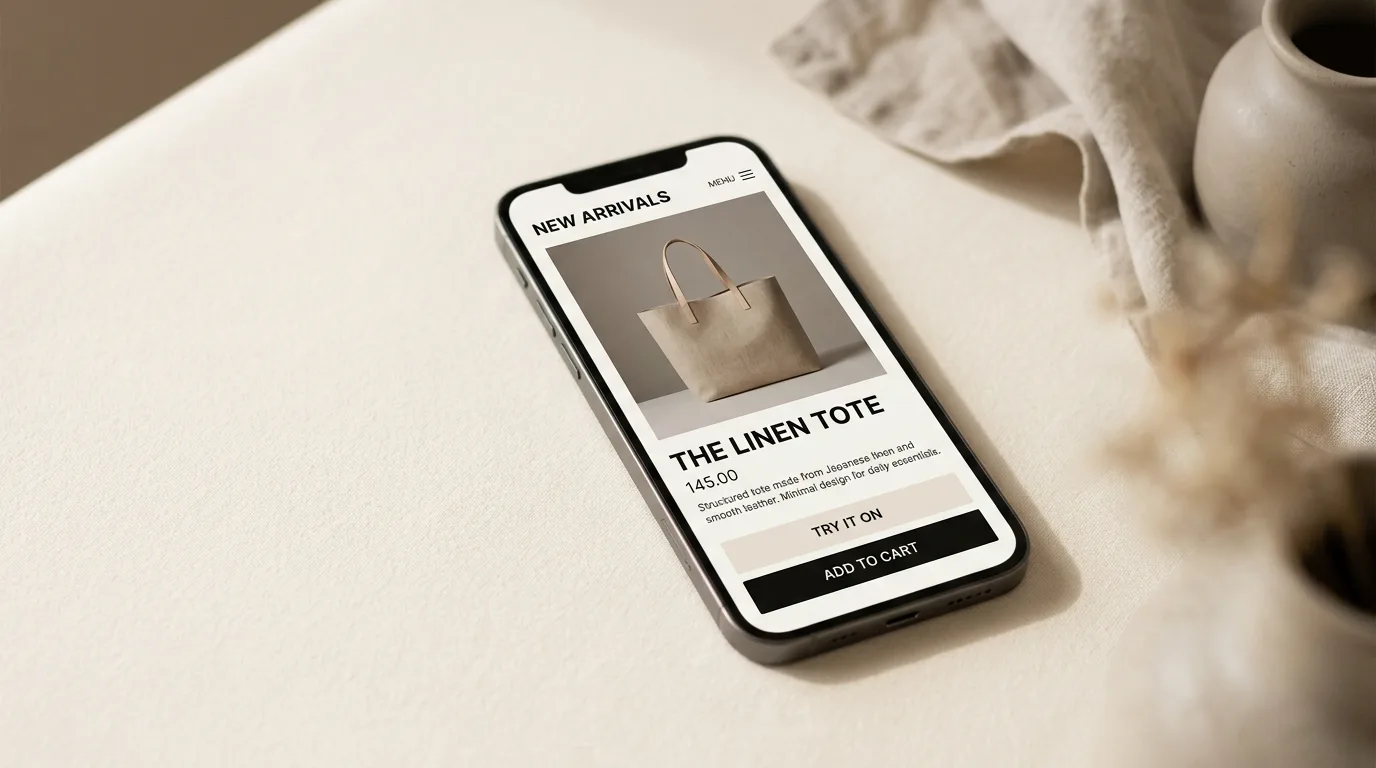
Placement matters for conversion. Position the try-on button directly below your product images — above the "Add to Cart" button, not in a separate tab or lower on the page. Merchants who place it above the fold see 40–60% higher engagement than those who bury it.
Step 4: Map Products to Models
Connect each product (and variant, where relevant) to its corresponding 3D model or enable AI swap. The merchant panel gives you a product-by-product management view to track what is live and what is pending.
Step 5: Set Up Conversion Tracking
Install Google Analytics 4 or use Shopify's built-in analytics to create a segment of "customers who used try-on" vs. "customers who did not." This lets you measure the actual conversion lift in your store, with your products, for your audience. Run it for 30 days before drawing conclusions.
Page-Level Optimizations That Amplify AR Try-On
AR try-on is most effective when the product page around it is already well-optimized. These changes work alongside try-on to compound the conversion lift.
Lead with the Try-On CTA
Do not hide try-on behind a static gallery. Lead your product page with the try-on experience as the primary call to action. A simple button labeled "Try it on your face" or "See it on you" positioned prominently above the fold tells the customer immediately that a better experience is available.
Use Social Proof Near the Try-On Button
Reviews and star ratings placed adjacent to the try-on button reinforce confidence at the moment of highest intent. A customer who is already looking at themselves wearing the product is in a ready-to-buy mental state — social proof at that moment converts at higher rates.
Show a Try-On Preview Thumbnail in Your Product Gallery
Including a screenshot or video of the try-on experience in your product gallery helps customers who are unfamiliar with the feature understand what to expect. The thumbnail itself acts as a call to action — curious customers click to try.
Optimize for Mobile
More than 60% of Shopify traffic is mobile. Test your product page on an iPhone — specifically, check that the try-on button is visible without scrolling and that it opens the camera experience smoothly. Mobile-optimized try-on consistently outperforms desktop in raw engagement volume, even if desktop converts at a slightly higher rate.
Measuring the Impact: Metrics That Matter
Conversion rate is the headline metric, but these secondary measurements give you a clearer picture of how try-on is working.
Try-on engagement rate — what percentage of product page visitors click the try-on button? A healthy rate is 8–15%. Below 5% usually means a placement or visibility problem; above 20% suggests a highly engaged audience or strong feature promotion. This number matters because your overall page lift scales with it.
Try-on-to-purchase rate — of the customers who use try-on, how many complete a purchase? This is your highest-intent segment and the figure that most closely reflects the Vertebrae 2–3× benchmark. Track it separately from overall conversion so you can see the true per-user effect.
Return rate delta — compare return rates for try-on users vs. non-users, and before vs. after enabling the feature. Industry data consistently puts the reduction at 25–40% for fit-critical categories. This metric often surprises merchants — the savings on returns can exceed the conversion revenue uplift, especially for categories with historically high return rates.
Revenue per visitor — divide total product page revenue by total product page visitors, before and after try-on. This is the single cleanest metric for overall page performance because it rolls up conversion rate, average order value, and return rates into one number without requiring you to isolate specific user segments.
Putting It Together: A 30-Day Roadmap
If you are starting from zero, here is a realistic 30-day plan to get meaningful conversion data.
Days 1–5: Install TryOn Virtual, identify your top 5 highest-traffic products in try-on-eligible categories, initiate 3D model generation or enable AI swap.
Days 6–14: Launch try-on on those 5 products. Optimize placement — above the fold, primary CTA. Set up a Google Analytics 4 segment to isolate try-on users from non-users so your data is clean from day one.
Days 15–30: Measure engagement rate, try-on-to-purchase rate, and return rate. If engagement is below 5%, adjust placement. If try-on-to-purchase rate is strong, expand to 10–20 more products.
Day 30+: Run a clean before/after comparison. For most merchants in fit-critical categories, this is where the business case becomes clear. Your own data — specific to your products, your audience, and your price point — will be more accurate than any industry benchmark.
Start With One Product
The merchants who see the fastest results do not try to enable try-on across their full catalog on day one. They pick their single highest-traffic product in an eligible category, get it live, and watch what happens to that product page's conversion rate.
One product. Thirty days. The data speaks for itself.
Start for free on the Shopify App Store — no credit card required, and your first 50 try-on sessions per month are included at no cost.
This article is part of The Complete Guide to Virtual Try-On in Ecommerce — our full breakdown of try-on types, product categories, ROI, and platform options.