Why Analytics Matter for Virtual Try-On
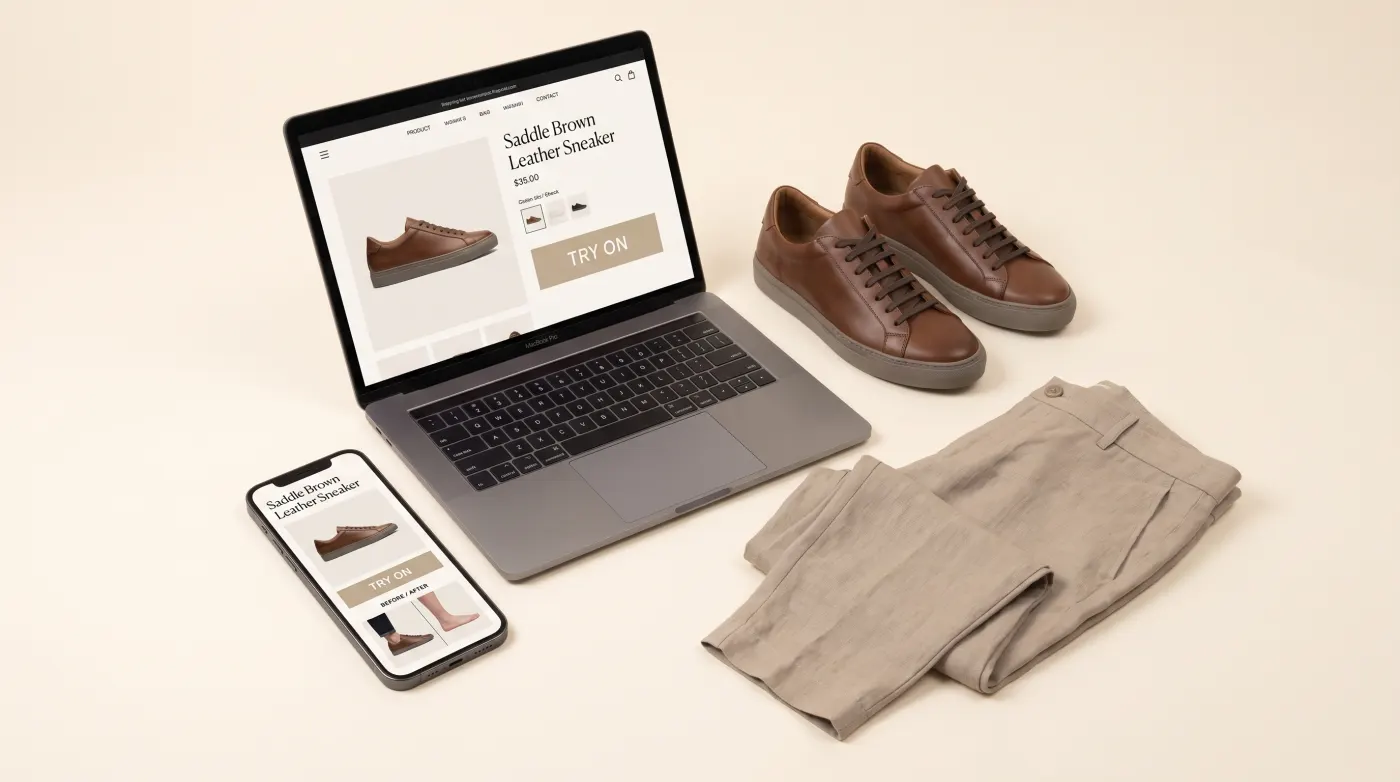
Installing a virtual try-on widget is only the first step. To understand whether it is actually driving business results — and to optimize it over time — you need analytics that go beyond simple page views.
Virtual try-on introduces a distinct engagement funnel that standard e-commerce analytics tools are not designed to capture. A customer might view a product page, click the try-on button, grant camera access, try on three different products, save a screenshot, and then add one to their cart. Each of these steps represents a decision point, and understanding where customers progress or drop off is essential for maximizing the feature's impact.
The Virtual Try-On Funnel
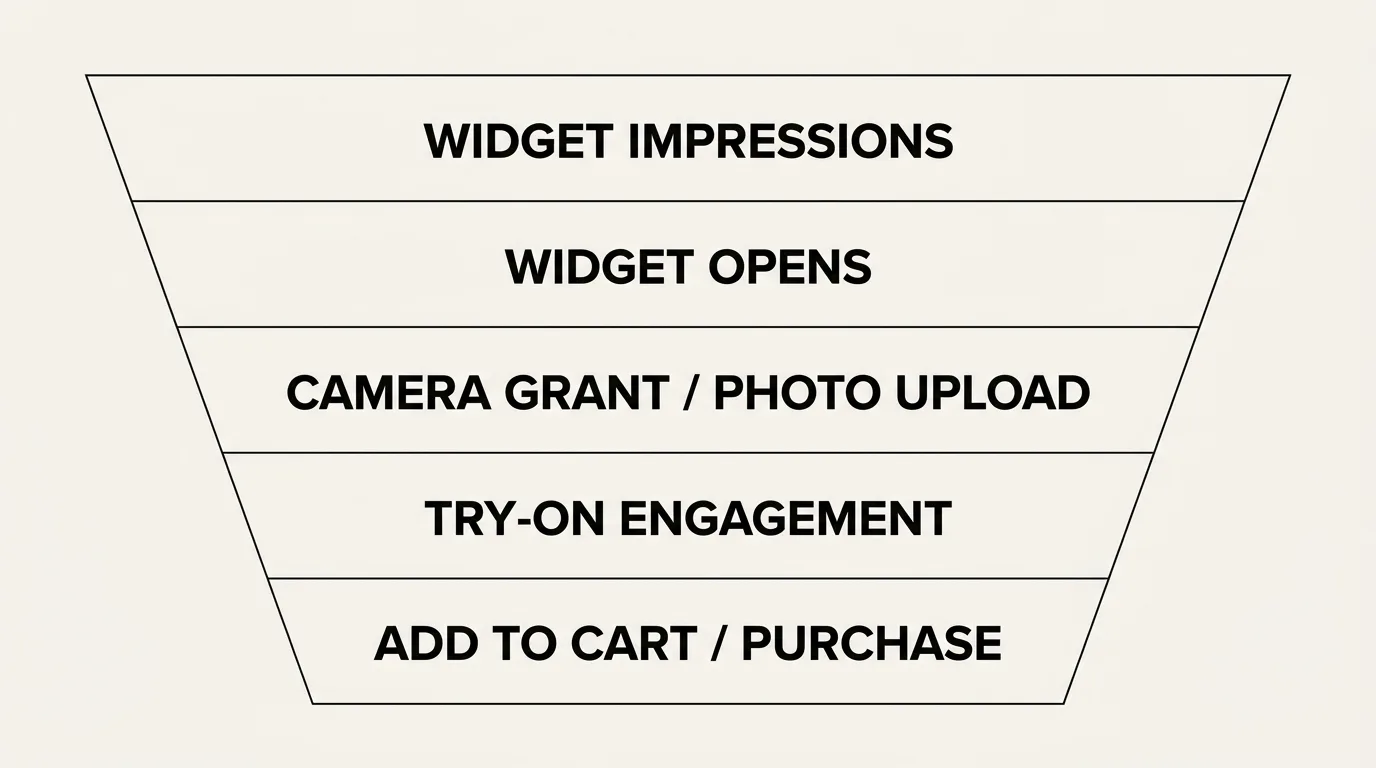
The try-on engagement funnel has five key stages. Tracking each stage independently lets you identify bottlenecks and optimize accordingly.
Stage 1: Widget Impressions
This is the number of product page views where the try-on button was visible. It is your top-of-funnel metric and tells you how many customers had the opportunity to try on a product.
What to watch for: If impressions are low relative to overall product page traffic, the widget may not be loading correctly on certain devices or browsers, or the try-on button may be positioned below the fold where customers do not see it.
Stage 2: Widget Opens
The number of customers who click the try-on button to open the try-on experience. The ratio of opens to impressions is your activation rate — the percentage of customers who choose to engage.
Healthy benchmark: 8-15% activation rate. If yours is below 5%, consider making the try-on button more prominent, adding a callout ("See it on you"), or repositioning it closer to the product images.
Stage 3: Camera Grants / Photo Uploads
For AR try-on, this stage tracks how many customers grant camera access. For AI swap, it tracks how many upload a photo. In both cases, this step requires the customer to share something personal, so there is natural drop-off.
Healthy benchmark: 60-80% of customers who open the widget proceed to grant camera access or upload a photo. If this number is low, privacy messaging may need improvement — reassure customers that photos are not stored and camera access is temporary.
Stage 4: Try-On Engagement
Once in the try-on experience, customers may try on multiple products, switch between variants, take screenshots, or save looks. This stage measures depth of engagement.
Key metrics:
- Products tried per session: average number of products tried in a single session (benchmark: 2-4)
- Session duration: average time spent in the try-on overlay (benchmark: 45-90 seconds)
- Screenshots saved: number of customers who capture their try-on result (benchmark: 15-25% of sessions)
High engagement at this stage indicates that customers find the experience valuable and are actively using it to make purchase decisions.
Stage 5: Post-Try-On Action
The ultimate measure of try-on effectiveness is what customers do after the experience. Key actions to track:
- Add-to-cart rate: percentage of try-on sessions that result in an add-to-cart event
- Purchase rate: percentage of try-on sessions that ultimately convert to a sale
- Return rate: return rate for orders that included a try-on interaction versus those that did not
Healthy benchmark: Try-on users should add to cart at 20-40% higher rates than non-try-on users on the same product pages.
Setting Up Tracking
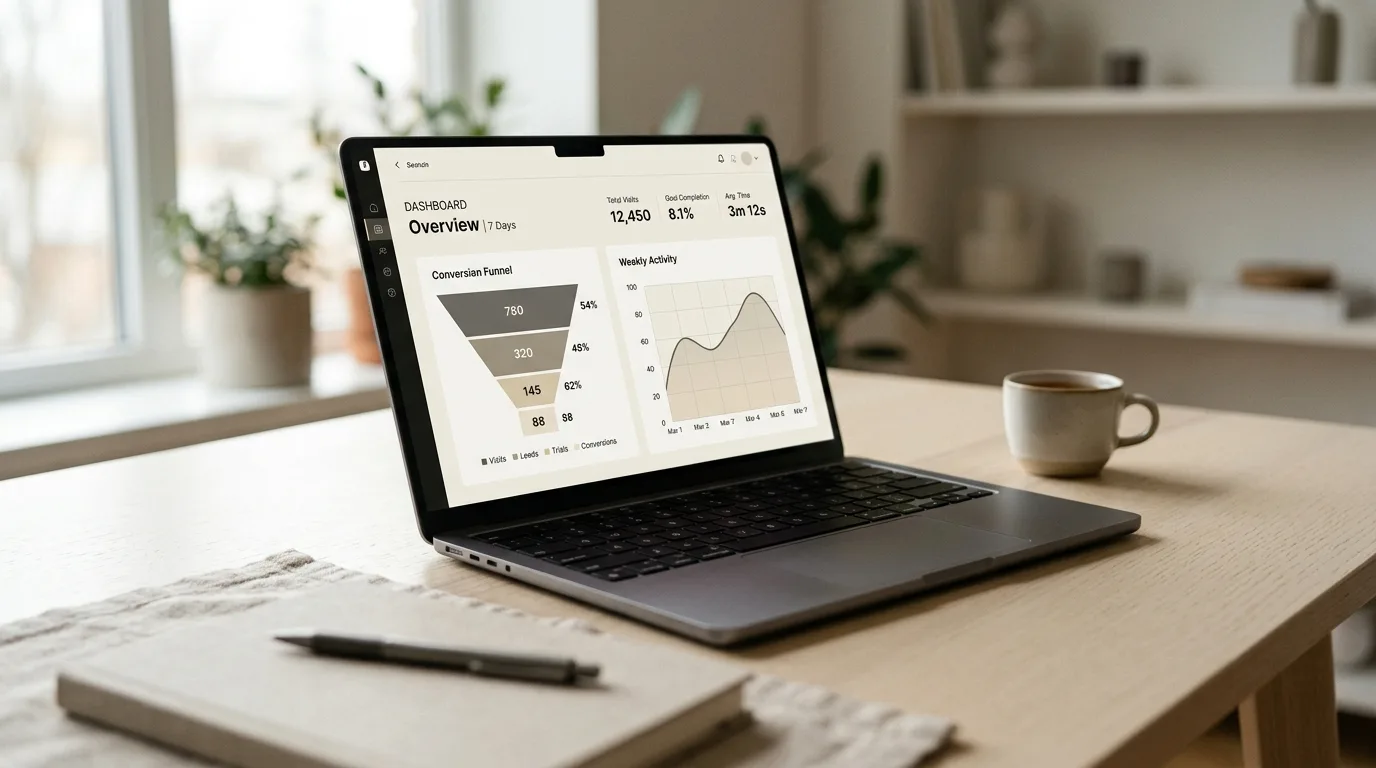
TryOn Virtual's analytics dashboard captures all five funnel stages automatically. No additional configuration is needed — the widget emits tracking events as customers progress through the experience.
Dashboard Metrics
The built-in dashboard provides:
- Overview: total sessions, activation rate, and conversion metrics for a selected date range
- Product breakdown: per-product engagement data showing which items drive the most try-on activity
- Device split: performance comparison across mobile, tablet, and desktop
- Trend charts: daily and weekly trends for all key metrics
- Export: CSV download for all data, compatible with Excel, Google Sheets, and BI tools
Integrating with External Analytics
For merchants who want to pipe try-on data into their existing analytics stack, the widget supports custom event callbacks. When a customer opens the widget, grants camera access, tries on a product, or adds to cart, the widget fires JavaScript events that you can capture and forward to Google Analytics, Mixpanel, Segment, or any other platform.
This lets you correlate try-on engagement with your broader customer journey data — session source, campaign attribution, lifetime value, and more.
Analyzing Product Performance
Not all products benefit equally from virtual try-on. Analytics help you identify which items drive the highest engagement and which may need attention.
High Engagement, High Conversion
These are your star products for try-on. Customers try them on frequently and convert at high rates. Feature these products prominently and ensure they have the best possible 3D assets or AI swap configurations.
High Engagement, Low Conversion
Customers are curious about these products but are not buying after trying on. This may indicate that the try-on result does not match expectations — perhaps the 3D model is inaccurate, or the product simply does not look as good as the product photos suggest. Investigate and consider updating the asset or the product photography.
Low Engagement, High Conversion
These products sell well but customers are not using try-on. The try-on button may be poorly positioned on the product page, or the product category may not feel like a natural fit for virtual try-on. Test repositioning the button or adding a prompt.
Low Engagement, Low Conversion
De-prioritize try-on for these products. Not every item benefits from virtual try-on, and resources are better spent optimizing products where the feature drives results.
Funnel Optimization Tips
Based on data from thousands of merchant deployments, here are proven tactics for improving try-on funnel performance.
Increase activation rate:
- Position the try-on button adjacent to the main product image, above the fold
- Use action-oriented copy: "See it on you" outperforms generic "Try on" labels
- Add a subtle animation or highlight to draw attention to the button on first page load
Increase camera grant / photo upload rate:
- Display a privacy statement near the permission prompt: "Your photo is not stored"
- Show a preview of what the try-on experience looks like before asking for camera access
- Ensure the permission flow is fast — minimize steps between button click and try-on
Increase post-try-on conversion:
- Add a visible "Add to Cart" button within the try-on overlay itself
- Show variant options (size, color) inside the try-on experience so customers can switch without leaving
- Enable screenshot sharing — customers who share their try-on look with friends are more likely to purchase
Measuring ROI
To calculate the ROI of virtual try-on, compare two cohorts over a 60-90 day period:
- Try-on users: customers who engaged with the try-on feature before purchasing
- Non-try-on users: customers who purchased the same products without using try-on
Compare these cohorts on three metrics:
- Conversion rate (try-on users should be higher)
- Return rate (try-on users should be lower)
- Average order value (may be higher for try-on users)
Multiply the differences by your order volume and average transaction value to arrive at a dollar figure. Most merchants find that the conversion lift and return reduction together deliver 5-15x ROI on the cost of the virtual try-on platform.
Getting Started with Analytics
If you are already running TryOn Virtual, your analytics are collecting data right now. Log into the analytics dashboard to review your current funnel performance.
If you are evaluating virtual try-on for the first time, analytics is one of the strongest reasons to start. Within 30 days of going live, you will have clear data on how customers interact with the feature and whether it is driving measurable business results. Explore the full virtual try-on platform or visit the merchant panel to get started.
This article is part of The Complete Guide to Virtual Try-On in Ecommerce — our full breakdown of try-on types, product categories, ROI, and platform options.